Frog Egg Extract: Biology and Model
This page gives further description on the biology behind the Frog Egg Extract model. This is part of the description for the frog egg use case.Early Embryogenesis in frogs
Soon after fertilization, a frog egg executes 12 rapid synchronous, autonomous cell divisions (DNA synthesis followed by mitosis and cell separation) to become a hollow ball of cells, called blastula, which then undergoes complex structural arrangements that ultimately give rise to a tadpole. The cell divisions are triggered by M-phase promoting factor (MPF), a protein kinase consisting of two subunits: Cdc2 (the catalytic subunit) and cyclin B (the regulatory subunit). When activated, MPF phosphorylate an array of proteins involved in chromosome condensation, nuclear envelope breakdown, spindle formation, and other events that leads to mitosis. As cells exit from mitosis, MPF activity drops and DNA is permitted to replicate, and cell separation is permitted to proceed. Thus, during early embryogenesis, the alternation of S and M phases and cell separation is controlled by temporal fluctuations of MPF activity.Why frog egg extracts?
The cell free extract of frog eggs prepared by the method of Murray & Kirschner, 1989 exhibits many properties of an intact egg, including the periodic activation of MPF. Since a cell-free extract is easier to manipulate and control than intact egg, it is used to study the molecular details about MPF activation.Mechanism of MPF regulation
There are two primary modes of regulation of MPF activity in frog eggs:- Although the catalytic subunit Cdc2 is present at constant levels throughout early developmental stages, its cyclin B partner fluctuates each cycle due to changes in its rate of degradation, which is carried out by an enzyme complex, called APC (anaphase promoting complex) or cyclosome. Since Cdc2 is catalytically active only when bound to cyclin B, MPF activity comes and goes with phases of cyclin synthesis and degradation in each cycle.
- MPF activity can also be modified by phosphorylation of the Cdc2 subunit. To be catalytic active, Cdc2 must be phosphorylated at a specific amino acid (threonine at position 167) and not phosphorylated at a different amino acid (tyrosine at position 15). The activatory phosphorylation at Thr-167 is carried out by the enzyme CAK, which is constitutively active, not subject to regulation, so we ignore it in the model. The inhibitory phosphorylation at Tyr-15 is carried out by a kinase called Wee1, and the reverse reaction by a phosphatase called Cdc25.
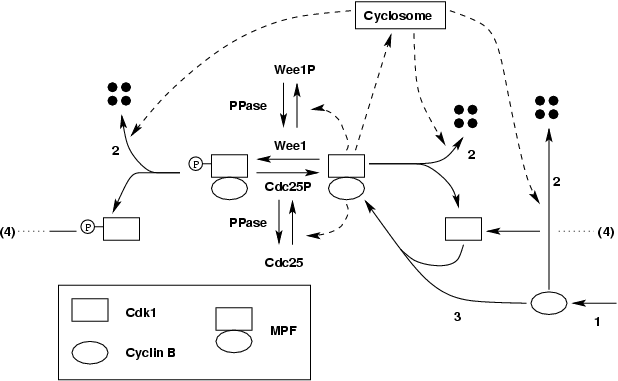
Because MPF can affect enzymes that control its activity, there are
feedback mechanisms in this regulatory
network as shown in the wiring diagram below.
MPF can activate its degradation machinery APC/cyclosome indirectly
through an intermediate step (IE), thus creating a negative feedback
loop.
On the other hand, MPF can inhibit its inhibitor Wee1 and activates it
activator Cdc25, thus creating two positive feedback loops.
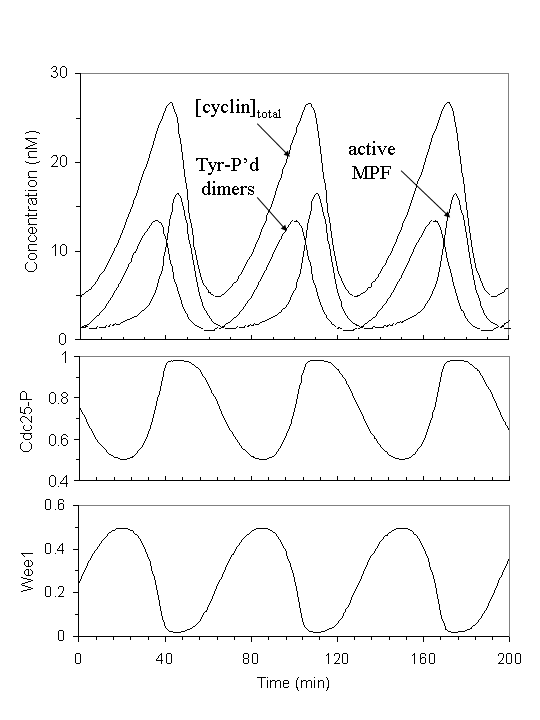
Autonomous oscillation of MPF activity
In egg extract, during interphase, as cyclins are newly synthesized, they are bound rapidly by the abundant Cdc2 subunit to form the unphosphorylated dimer, which is then quickly converted mostly to the inactive, phosphorylated form (with a small fraction in the active form), because Wee1 is active, and Cdc25 inactive. As more cyclins are made, more inactive MPF (in the same proportion, a slight more active MPF) are formed. When enough active form is accumulated above the threshold to trigger the positive feedback loops, a sharp transition from interphase to mitosis occurs. The phosphorylated inactive MPF is abruptly converted to the active form as Wee1 is inactivated and Cdc25 activated. When MPF is activated, it turns on the degradation machinery APC/cyclosome, causing cyclin B to disappear. The control system then falls back to interphase with low MPF activity, and the cycle repeats itself.
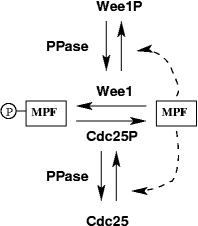
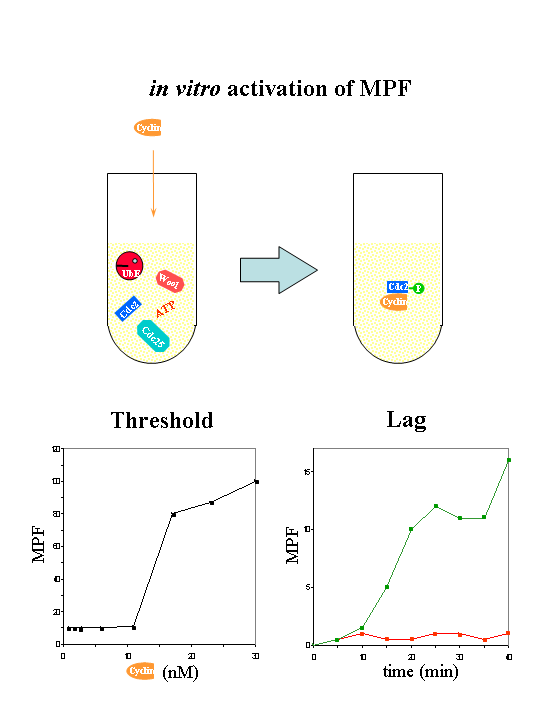
Solomon's experiment on MPF activation
To study the mechanism of MPF activation and inactivation by phosphorylation, Solomon (1990) designed an experiment, in which he eliminated the involvement of cyclin synthesis and degradation. He used frog egg extract that was treated with cycloheximide to inhibit cyclin synthesis (so in the extract, there are free Cdc2 monomers and all the regulatory enzymes Wee1, Cdc25, CAK, but no cyclin B), and he added exogenously a modified form of cyclin B that is non-degradable. He studied a reduced system, shown in this wiring diagram.
He measured the time course of MPF activation as he varied the amount of non-degradable cyclin B. He found that there is a threshold level of cyclin B that is needed for MPF activation: below which, there was little MPF activity generated, but larger amount induced considerable activation. He also observed there is a time lag between the time of cyclin B addition and activation of MPF activity, the time lag seemed to be quite constant over a large range of input cyclin B concentration, it decreases slightly with higher [CycB].
Novak and Tyson's model to explain Solomon's experiment on MPF activation
Novak & Tyson (1993) hypothesized that the cyclin threshold for MPF activation, as observed by Solomon, is due to the positive feedback loops of MPF activating Cdc25 and inhibiting Wee1. Their explanation can account for the observed time lags as well. In addition, they predicted that there will be a different, but lower cyclin threshold for MPF inactivation. They argued that it takes higher MPF activity to turn the positive feedback loop ON; once it is ON, it requires less MPF activity to keep it ON, thus the cyclin threshold for MPF activation is higher than the threshold for MPF inactivation.
Marlovits (1998) used rate constants estimated from the experimental data in the table below, and refined the model to account for Solomon's experiments and many other experiments involving DNA checkpoints. The prediction of a different lower cyclin threshold for MPF inactivation was confirmed experimentally by Sha (2003).
Test Case for the JigCell Automatic Parameter Estimation
Because of its simplicity, the model for Solomon's experiment is used
as the test case for JigCell's automatic parameter optimization program.
The parameters estimated by Marlovits (1998)
serve as the starting point for the optimizer.
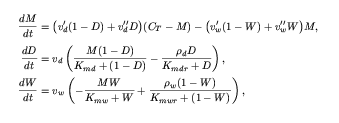
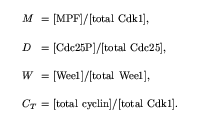
The differential equations and the experimental data below are entered
into JigCell Model Builder and Comparator for use by the optimizer.
 |
 |
Experimental Data
The following table lists the precise data values used to validate the model, along with their citations.
Name |
Data |
Deacription |
MPF mphase activation L |
(2, 0.75) |
Kumagai & Dunphy 1995 Fig 4b. Determination of rate constants of Cdc25 phosphatase (vd and vd), using inactive MPF as substrates, in M-phase extract when Cdc25 is active, and in interphase extract when Cdc25 is inactive. |
MPF interphase activation L |
(2, 1.0) |
|
Cdc25 activation Ca |
(1.25, 0.8) |
Kumagai & Dunphy 1992 Fig 10. Determination of rate constants of MPF in activating Cdc25 (vd, Kmd) in M-phase extract when MPF activity is high; and the rate constants of PPase (rho_d and Kmdr) in interphase extract when MPF activity is low. |
Cdc25 inactivation Ca |
(5, 0.75) |
|
Wee1 inactivation Wa |
(2, 0.5) |
Tang Coleman & Dunphy 1993 Fig 2. Determination of rate constants of MPF in inactivating Wee1 (vw, Kmw) in M-phase extract when MPF activity is high; and the rate constants of PPase (rho_w and Kmwr) in interphase extract when MPF activity is low. |
Wee1 activation Wa |
(7.5, 0.5) |
|
MPF activation / inactivation |
(0.18, 0.06) |
J. Moore (Sha, 2003). |
Total Cyclin time lags |
(0.2, 45) |
J. Moore (Sha, 2003). Measurement time lags for MPF activation with different amounts of added non-degradable cyclin. |
Back to Frog Egg Use Case to see how JigCell software is used to accomplish this task.